Single Candle Stick Pattern- Paper Umbrella

Single Candle Stick Pattern- Paper Umbrella

Paper Umbrella Introduction

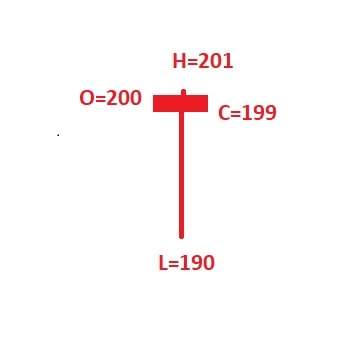
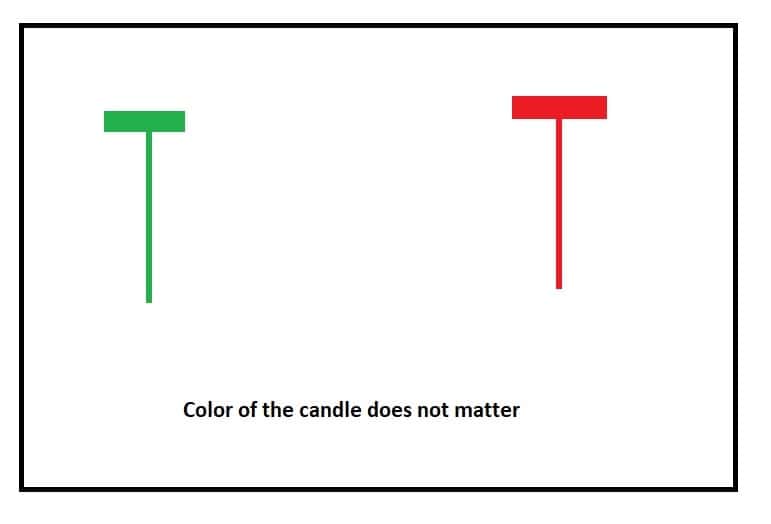
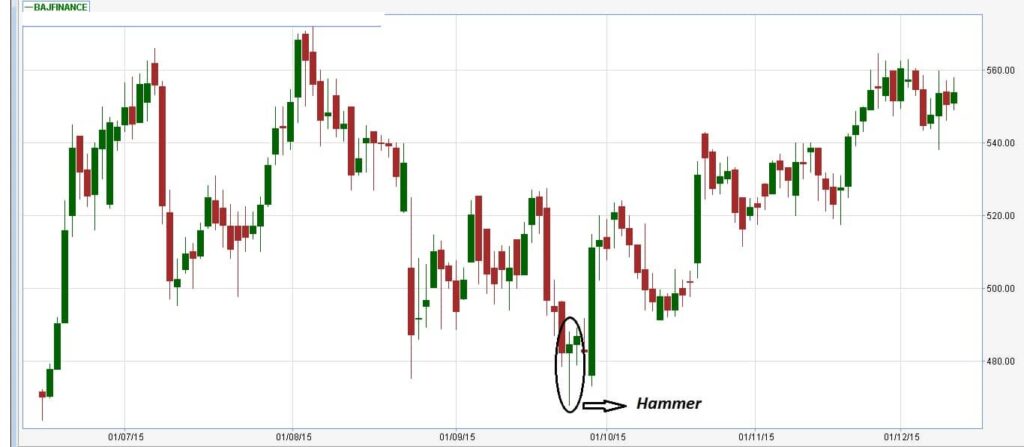
Paper umbrella is a single candle stick pattern which indicates a reversal signal of the earlier trend. The prerequisite to a valid paper umbrella pattern is that it should appear after a stock is in uptrend or downtrend. There are two variants of this pattern:

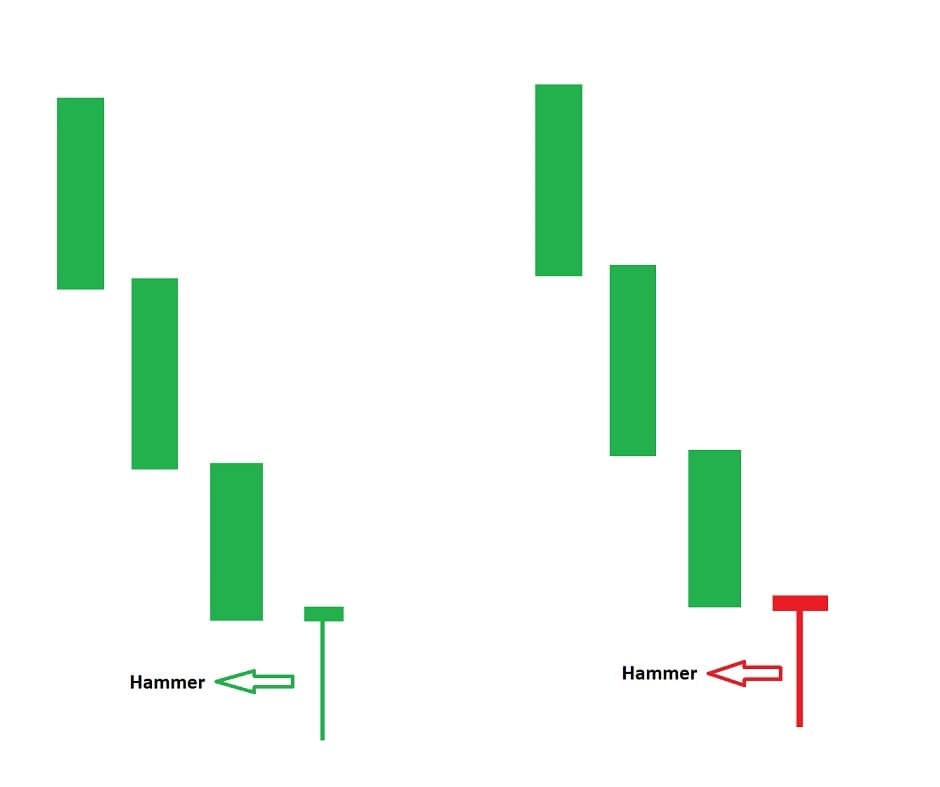
  1. Hammer: Paper umbrella pattern is called as Hammer when the stock is in downtrend and paper umbrella pattern emerges. There is high probability of stock changing its direction from downtrend to uptrend when Hammer pattern appears in the chart.
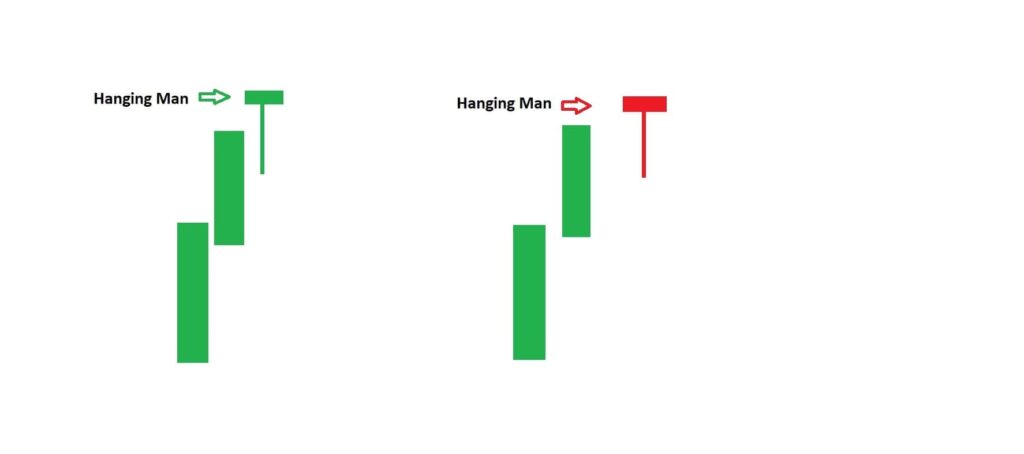
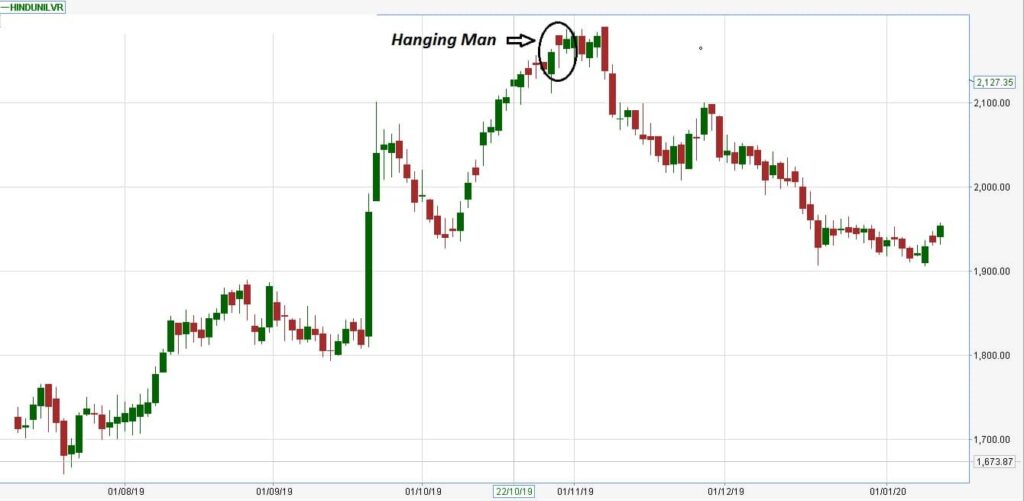
  2. Hanging Man: Paper umbrella pattern is called as Hanging man when the stock is in Uptrend and paper umbrella pattern emerges. There is high probability of the stock changing its direction from uptrend to downtrend when Hammer pattern appears in the chart.


How Paper umbrella pattern looks like?

It has a small body at the top and long wick at the lower end of the candle. The prerequisite is that lower wick should be at least twice the length of body. For example: A stocks open at Rs 200, hits high of Rs 201, low of Rs 190 and closes at 199, this qualifies as paper umbrella as open and close has a difference of only Rs 1 & difference between close and low is Rs 9. A candle with look like this:

Paper Umbrella

The color of the candle does not matter for paper umbrella as both green or red candles have same implication. It is a reversal signal if it appears after the stock is in uptrend or downtrend.

Paper Umbrella

You must be thinking of Hammer and Hanging man. Both looks similar in terms of candle formation. The only difference is if the stock is in downtrend and paper umbrella emerges. Then it is called as Hammer. In case the stock is in uptrend and this candle emerges. Then it is called as Hanging man.

Psychology behind formation of Hammer

The stock is in downtrend and every day a stock is hitting a fresh low. This continues till the Hammer pattern appears on the chart. This has an implication to reverse the trend. Let’s understand the psychology behind formation of the candle through a diagram:

Paper Umbrella

In this diagram, the stock is clearly in downtrend and each candle is hitting fresh low. On Hammer candle, the stock hit another low but could not sustain. From low level, bulls manages to take the stock back to the opening price and stock closes near opening price itself. This will create a doubt in the mind of bears that stock downtrend is over and better will be to close short position. They will reverse their position by buying back the stock. This will further bring demand for the stock and stock will reverse to uptrend.

Psychology behind formation of Hanging man

The stock is in uptrend and every day a stock is hitting a fresh high. This continues till the Hanging man pattern appears on the chart. This has an implication to reverse the trend. Let’s understand the psychology behind formation of the candle through a diagram:

Paper Umbrella

In this diagram, the stock is clearly in uptrend and each candle is hitting fresh high. On Hanging Man candle, the stock hit another high but could not sustain. From high level, bears manages to take the stock back to the opening price and stock closes near opening price itself. This will create a doubt in the mind of bulls that stock uptrend is over and better will be to close the buy position. They will reverse their position by selling the stock. This will further bring supply for the stock and stock will reverse to downtrend.

Significance of Paper Umbrella

These candles suggest a reversal to earlier trend. The important point to discuss here is that the color of candle does not make any difference. Lets understand its importance through technical charts:

1. Hammer in Downtrend

  • First example is of Bajaj Finance with a stock is in an uptrend, Hammer emerges on the chart and stock reverses its direction. It is acting as a reversal signal.
Paper Umbrella

2. Hanging man in Uptrend

  • Second example is of Hindustan Uniliver stocks that was in uptrend till Hanging Man pattern and reverses its direction to downtrend direction. It is acting as reversal pattern
Paper Umbrella

How to use the pattern effectively?

Paper Umbrella as discussed is a reversal pattern and can be used effectively in the following manner:

  1. If you have already bought a stock at lower price and stock is in uptrend, Hanging Man patterns are really useful to trader as he can sell the stock at current market price on emergence of this pattern. This will result him to book good profits. Since this is a reversal pattern and guide to exit trade.
  2. You can initiate a fresh short in the stock on next day of hanging Man at around 3:20 P.M. After receiving confirmation that the candle emerges on next day is red in color that indicates bearishness. The stop loss will be the highest prices of the hanging man candle.
  3. If you have already short the downward trending stock at higher price than you can close your short position on appearance of  hammer pattern. This will result in good profit and will minimize risk of reversal. This is how he can make good profits.
  4. This also provide an opportunity to enter at lower price. If hammer emerging in downward trending stock than the trader can go long with 50% of the decided amount. In case stocks start moving up than he can put remaining 50% capital. This will result in lowering average buying price and making good entry price. Stop loss to be maintained at the lowest price of the hammer.

This Post Has One Comment

Leave a Reply