Technical analysis is based upon chart reading to identify the short term opportunities based upon the stock price action. There are different charts available:
Line Chart
OHLC Chart
Candle stick chart
A stock is traded on different prices on each day and generates four important prices: open, high,low and close. Based upon this information, these charts are created. Let us understand with the help of an example of Ashok Leyland ltd stock information to make it clear.
Date
Open
High
Low
Close
29-04-2020
45.2
48.8
44.5
48.0
30-04-2020
49.1
53.2
49.1
52.3
04-05-2020
50.0
51.5
48.3
49.3
05-05-2020
49.7
50.8
47.9
48.3
06-05-2020
48.5
49.5
47.2
47.6
07-05-2020
47.4
49.0
45.8
46.1
08-05-2020
47.4
49.3
46.1
47.0
11-05-2020
47.5
49.4
46.5
48.8
12-05-2020
48.7
49.1
46.7
48.6
13-05-2020
52.0
52.0
48.2
48.8
14-05-2020
48.0
49.6
47.4
49.3
15-05-2020
49.3
49.4
46.9
47.2
18-05-2020
47.2
47.3
42.5
43.8
19-05-2020
44.3
45.3
42.8
43.0
20-05-2020
43.0
43.5
42.3
43.3
21-05-2020
43.3
46.5
43.0
46.1
22-05-2020
45.7
45.8
43.4
43.6
26-05-2020
44.0
44.5
43.1
43.5
27-05-2020
43.8
44.1
43.0
43.2
28-05-2020
43.7
44.75
43.2
44.4
Data from Yahoo finance
The data reveals that each day, a stock experiences the opening price, highest price, lowest price and closing price. A technical analyst tries to create a chart based upon this information to identify the trading pattern.
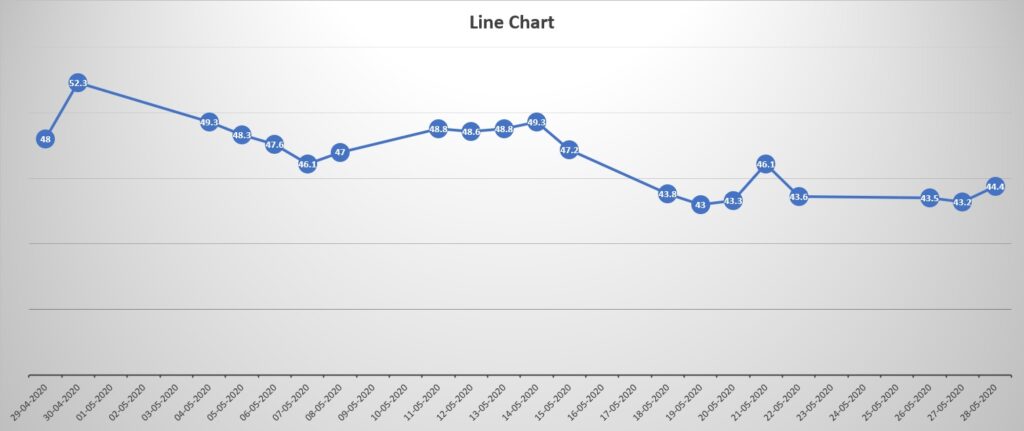
Lets' Understand Line Chart
Line chart is based only upon the closing price of a stock on each day. It is plotted by joining the closing prices that stock experiences on any trading day. This chart is useful to identify the direction of the stock. Lets Understand with the help of an example.
Date
Close
29-04-2020
48.0
30-04-2020
52.3
04-05-2020
49.3
05-05-2020
48.3
06-05-2020
47.6
07-05-2020
46.1
08-05-2020
47.0
11-05-2020
48.8
12-05-2020
48.6
13-05-2020
48.8
14-05-2020
49.3
15-05-2020
47.2
18-05-2020
43.8
19-05-2020
43.0
20-05-2020
43.3
21-05-2020
46.1
22-05-2020
43.6
26-05-2020
43.5
27-05-2020
43.2
28-05-2020
44.4
Ashok Leyland Ltd: Only Closing Prices Captured
Based upon this information, all closing points are connected to form a line chart. Have a look on line chart:
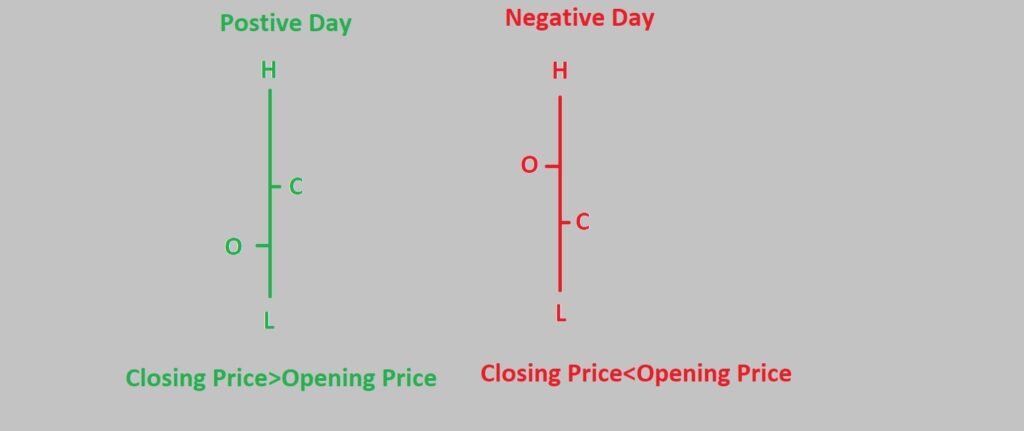
Lets' Understand OHLC Chart
The OHLC chart full form is Open, High, Low and Close chart is a western style technical chart. The important piece of information is four prices revealed by the chart each day. Have a look on a given diagram.
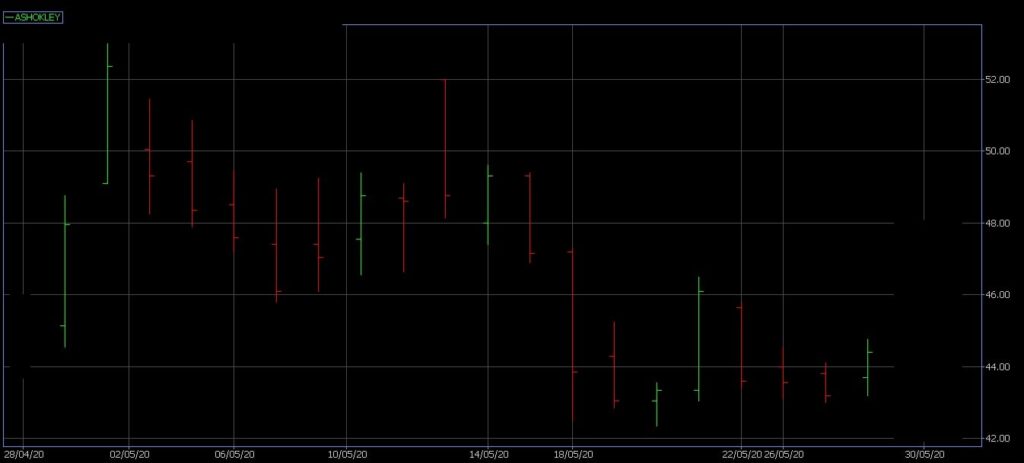
Each day the stock experiences the four prices. The OHLC chart reveals all this information. In the above diagram, you are seeing different colors of the bar (green/red). Green bar means that the day is positive or bullish, as close is greater than the opening price. Red bar means that the day is negative or bearish, as opening price is greater than the closing price. Lets construct the OHLC chart for Ashok Leyland ltd. based upon above data.
No doubt, the OHLC chart is better than line chart but it lacks on visualization. The candle stick chart reveals the same data in better visualize manner and most of the traders use the Japenese candlestick chart to identify short term trades.
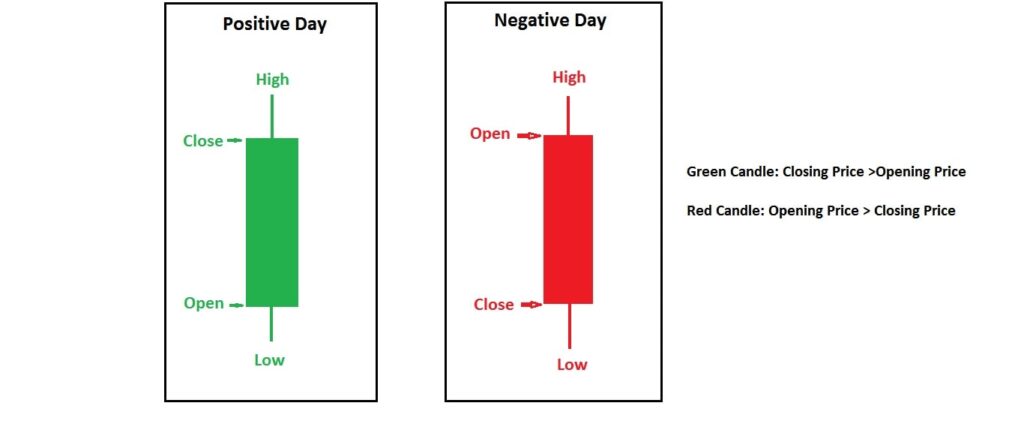
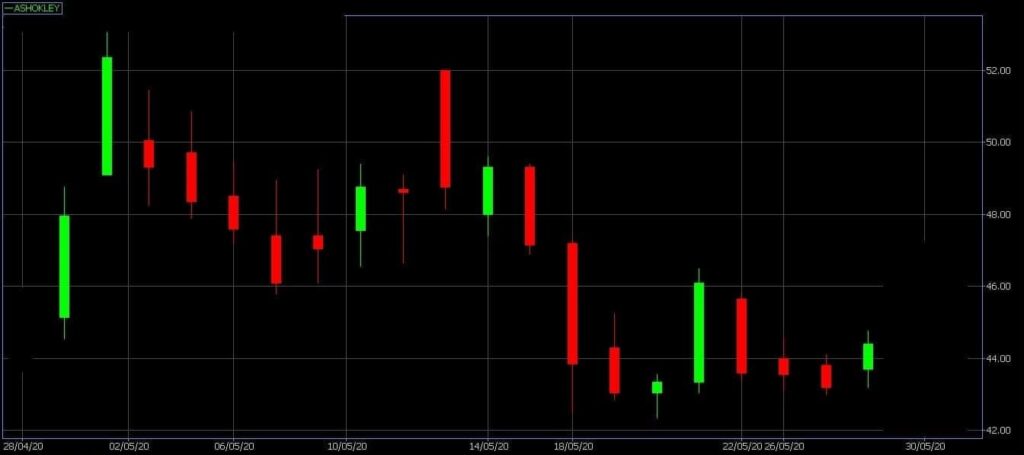
Lets' Understand Candlestick Chart
The most important chart that technical analyst use is candle Stick chart. The chart also reveal all the important information like open, high, low and close. Have a look on each candle:
Each candle is colored with either green or red. Green candle means that the day is positive or bullish, as closing price is greater than opening price. Red candle reveals that the day is negative or bearish, as opening price is greater than closing price. Lets construct the candle stick chart for Ashok Leyland ltd based upon above data.
You can clearly see that candle stick chart score better than OHLC chart. Japanese candle stick chart has given name to each candle. That we will explore over the period of time in this course. These candles help in identifying the short terms trading opportunities.