In this course, you will understand the important patterns that appears on Technical charts on the basis of which you can enter into profitable trades. This course will cover each and important concepts that will make you a successful trader. This will help you in building your passive income. The course will be full of examples that will introduce you to both bullish and bearish patterns. This will guide you when to enter into trade, when to exit the trades and where to keep stoplosses? You will understand risk – reward ratio and also learn that each trade can’t be profitable but if you follow a system of trading than outcome will be positive and you will make handsome return over the period of time.” Our Motto is to make you successful trader”.
Is It Neccessary To Make Profit In Each Trade?
No, is the answer. We are introducting you a system of professional traders that trade on the basis of Risk- Reward Ratio of atleast 2:1. This means that they enter only in that trades that has a potential of making money of Rs2 for every Rs1 risk. It means that for every Rs1 risk, they aim to make profit of Rs2. Lets explain through this video what it means. This is the most important topic to understand to become a successful trader.
Free Trading Software
Trading view is a free website for traders where you can find Technical Charts for all the Indian stocks. The website is easy to use https://www.tradingview.com/ , here you can create your account or login using your Gmail. And start reading charts to identify profitable trades for you and earn profit. We have created a video for you to introduce this website. Sit back and enjoy.
Open Demat Account
You need a demat account to start trading in stocks and apply all the knowledge of technical analysis as well as fundamental analysis to earn income from the stocks. Since we are offerring you deep knowlege on Technical course that will help you in stock selection. The best way to learn is to apply the knowledge practically.
We are offerring you demat account with free account opening charges with lowest brokerage (0.02% Intraday, 0.20% in Delivery and Rs20 on Options). Once you open Demat contact us at 9906357069 to reduce implement this brokerag
How to Buy or Sell share using Indus Indus Securities Trading App- Tick Pro plus?
Introduction to Technical Analysis
In this course, you will understand the important patterns that appears on Technical charts on the basis of which you can enter into profitable trades. This course will cover each and important concepts that will make you a successful trader. This will help you in building your passive income. The course will be full of examples that will introduce you to both bullish and bearish patterns. This will guide you when to enter into trade, when to exit the trades and where to keep stoplosses? You will understand risk – reward ratio and also learn that each trade can’t be profitable but if you follow a system of trading than outcome will be positive and you will make handsome return over the period of time.” Our Motto is to make you successful trader”.
Technical analysis of stocks helps you in identification of short-term trades that will be based upon the reading of historical action of stock prices and finding out the profitable patterns to initiate a trade. The beauty of the subject is its applicability on any asset class that has history of trading. Once you learn the subject, you can easily apply to any asset class available in this world.
Traders have to learn the types of charts, different time-frames, patterns that emerges on the charts, formation of support & resistance lines, importance of volume and technical indicators. All these factors together help a trader to take a position either to buy a stock or sell it.
A stock is affected by fundamental news, emotions, demand- supply dynamics, political and global information. Technical analysis covers all the information that affects a stock price by merely reading a technical chart and one can easily identify how stock is reacting to this information.
Once a trader learns the concept of Technical Analysis. It will free him from emotional biasness and he can trade in a systematic manner. Since the study helps in understanding the movement of stock price. He can easily know whether to buy or sell stock. Also, it helps to build a system to place a stop-loss on key areas to safeguard a trader from incurring huge losses
How to Find Stocks to Trade- NSE India Website?
Japenese Candlestick
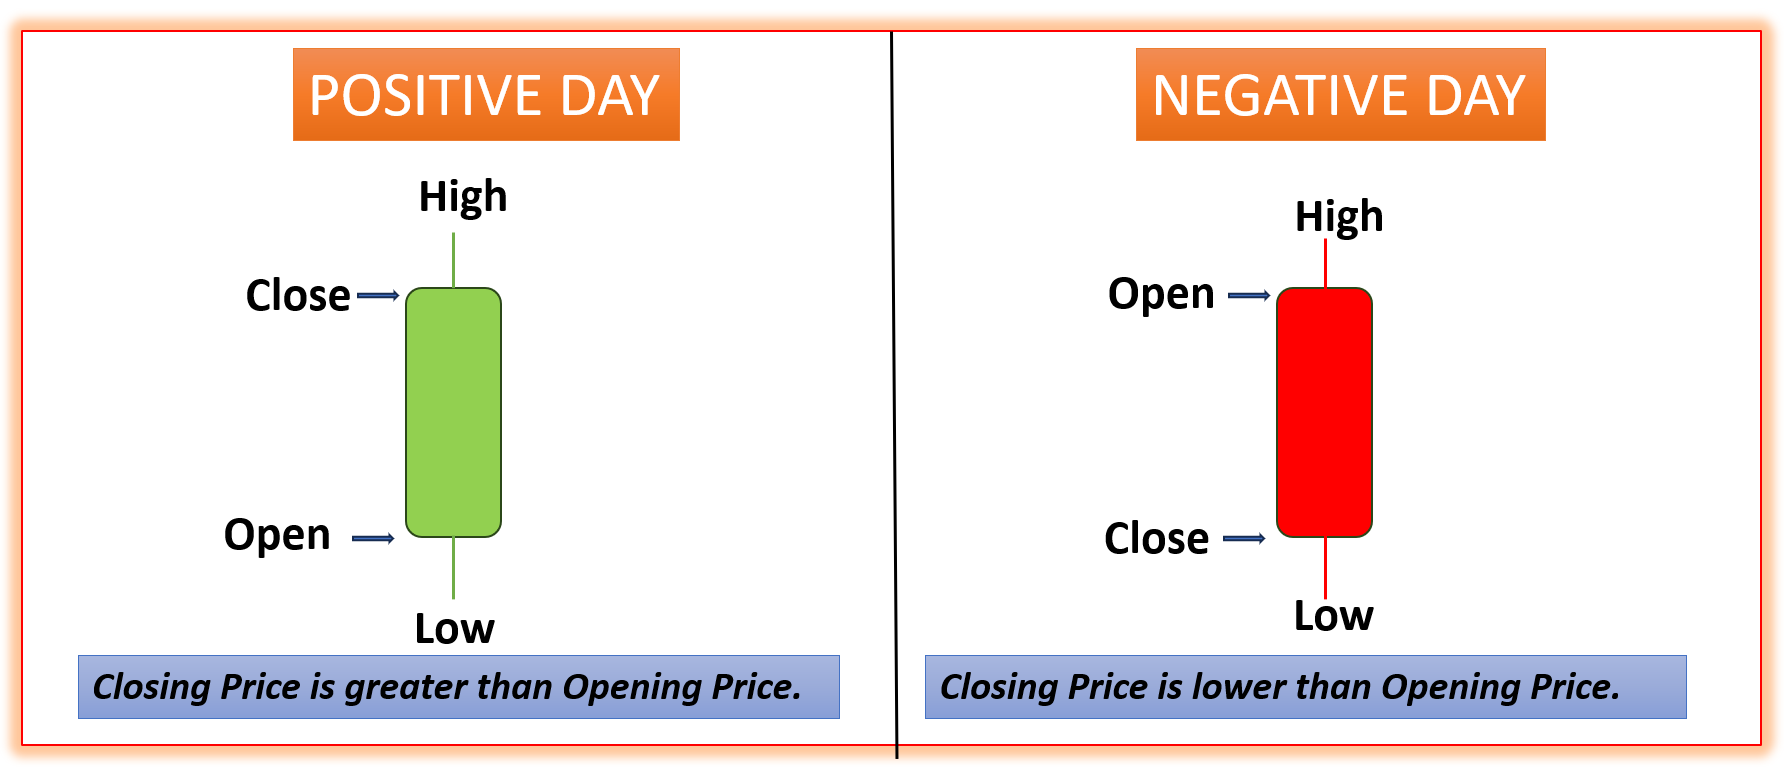
The most important chart that a technical analyst use is Japenese Candlestick chart. Each candle reveals an important information that a trader require to trade & make informed decison like opening price of the stock on a given day , highest price of the stock on that day, lowest price the stock on that day and closing price of the stock. This will help him to understand whether the day was bullish or bearish. Have a look on two types of candles: Green Candle means a Bullish Day & Red Candle means a Bearish day.
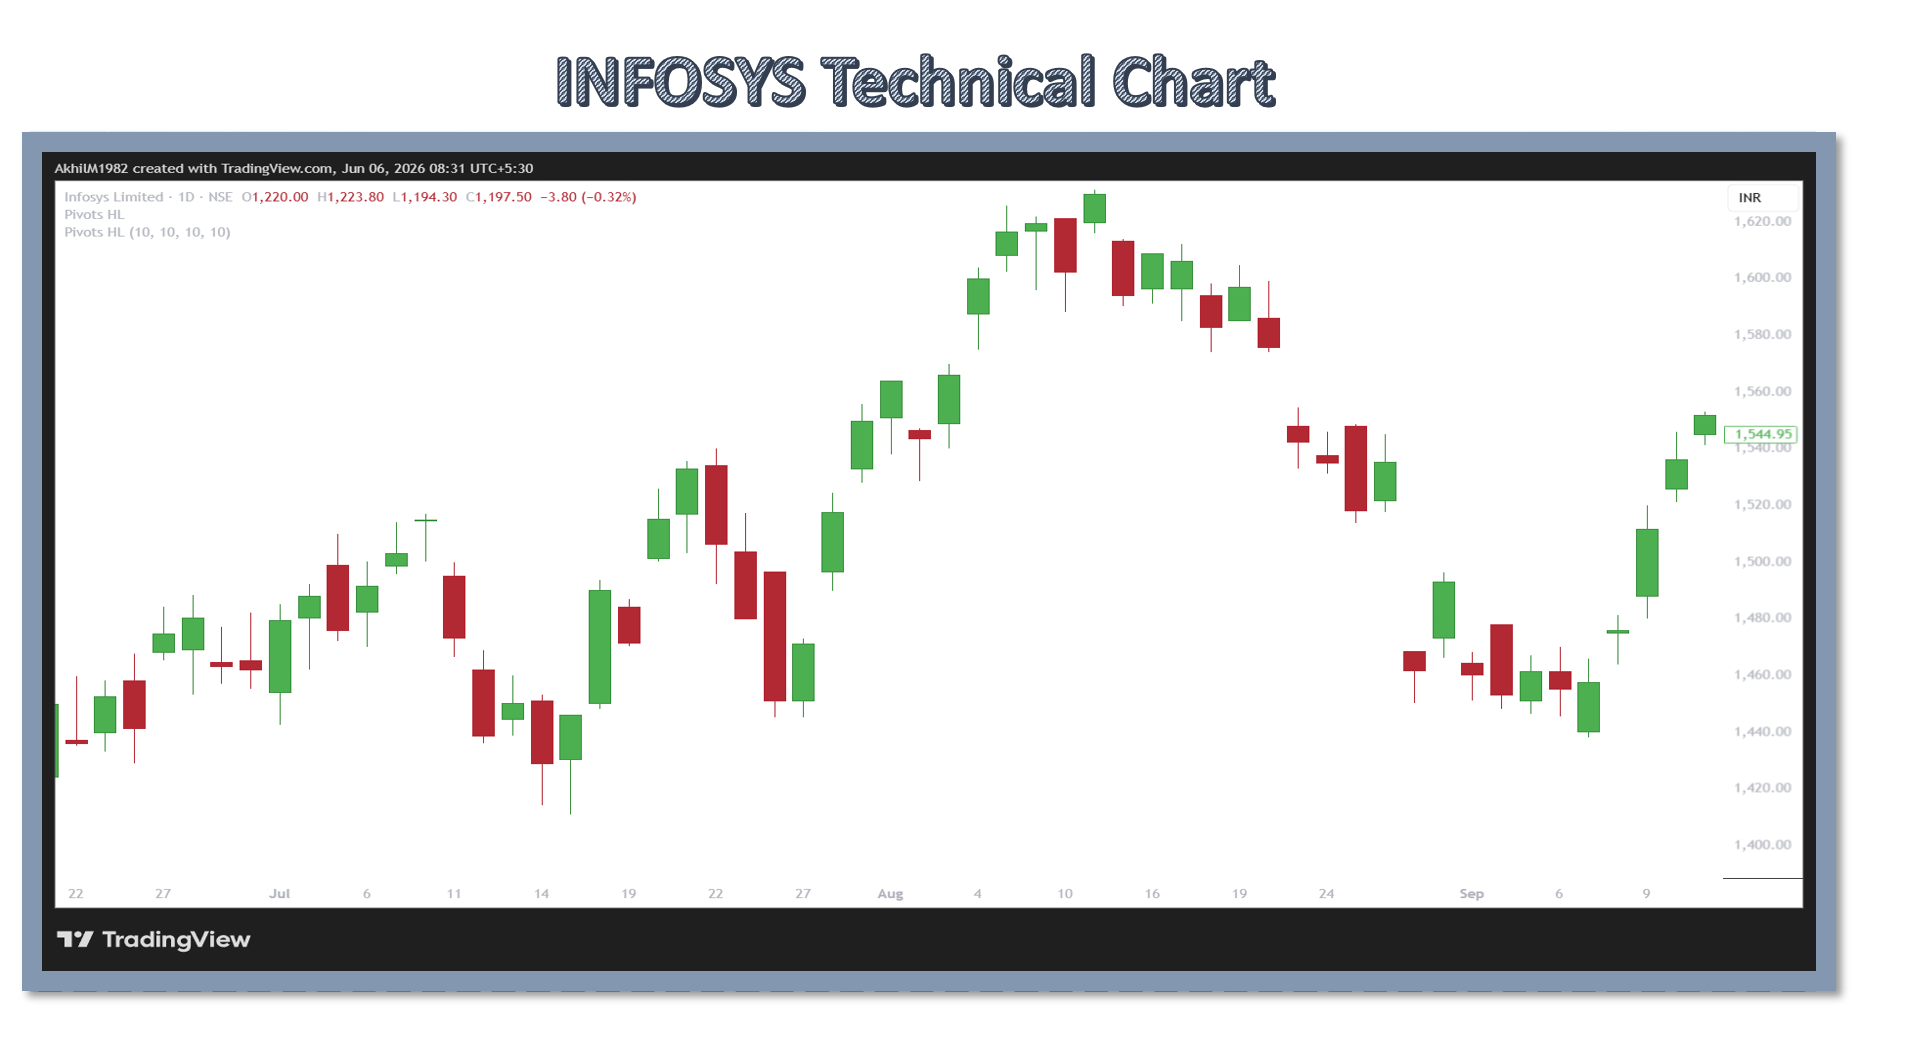
Each candle is coloured with either green or red. Green candle means that the day is positive or bullish, as closing price is greater than opening price. Red candle reveals that the day is negative or bearish, as opening price is greater than closing price. Let’s introduce you to Technical Chart.
In this course, we will teach you how to read the a Candlestick chart on the basis of which Trader has to decide whether to buy or sell a given share like in this case Infosys share. You will understand both bullish or bearish patterns. In order to make you understand the concept in simple manner, we will create lot of videos on each topic. Be patient & enjoy our free course.
1. Bullish Patterns
In this section, we will introduce you to 4 bullish patterns that when appear on Technical Charts that will help you in making money by buying the stocks at lower level & selling at higher level resulting in profit. The names of the bullish patterns are:
Hammer
Bullish Engulfing
Piercing Pattern
Morning Star
Now we will explain all these patterns one by one. For this we have created you tubes videos that will explian each one of them. Sit back & enjoy each video in detail.
2.Bearish Patterns
In this section, we will introduce you to 4 bearish patterns that when appear on Technical Charts that will help you in making money by selling the stocks at higher level & buying at lower level resulting in profit. The names of the bearish patterns are:
Shooting Star
Bearish Engulfing
Dark Cloud Pattern
Evening star
Now we will explain all these patterns one by one. For this we have created you tubes videos that will explian each one of them. Sit back & enjoy each video in detail.
3. Doji Candle & Trading Strategies.
Doji is a confusion candle that creates a confusion in the mind traders. When it appears in uptrend than their high probability of reversal in the stock and this may result in correction of the share. And same thing happens when stock is in downward trend and doji candle appears in the stock than their is high probability that stock may start going up. In this section, I am attaching You Tube videos that will guide you right ways to trade when Doji candle appear in the chart . Sit back & enjoy.
4. Window & Trading Strategies
Window is a Japenese name given to Gap Up Opening & Gap Down Opening. When Gap Up opening is there that is called Rising Window & when Gap down opening is there that is called Falling Window
It is a consolidation pattern when it appears in Uptrend than stock has high probability of stock rising further swiftly. Same thing happen when stock is falling and falling window appears than stock will fall further swiftly. I am attaching You Tube videos that will guide you on how to trade on the basis of both rising window & falling window.
5. Trading System Based Upon Bollinger Bands and Candlesticks Patterns
In this section, we will provide you a system to identify the stocks at underpriced or overpriced zones. This will help you to buy the stock at right price and at the same time you know when to sell the stock. The Bollingers Bands was developed by John Bollinger in 1980’s but it is stll relavent in the world of trading. We have combined Bollinger band and Candlestick patterns to generate buy or sell signal. Sit back and enjoy these videos.
Every Saturday more videos will get added that will make you professional trader. So my request keep coming back in this course link to remain updated with new content.